
Chubb Limited (CB)
Financials4 articles
Price chart
Why is CB moving today?
+2.0%CB is +2.0% today, inside the ordinary range for a session (under 3%). No stories about it reached the feed in the last 24 hours.
What this does not prove. A story on the same day is evidence of timing, not of cause: it explains a move only if it accounts for the size and the direction, and most single-stock moves carry a sector or index component too. Nothing here is a forecast.
Source: Yahoo Finance - quote as of 2 days ago
Chubb Limited (CB) overview
Chubb is one of the world’s largest property-and-casualty insurers.
CB is a member of the S&P 500. It sits in the Financials sector. That sector covers banks, insurers and capital-markets firms at the center of the economy.
Chubb Limited trades on the NYSE under the ticker symbol CB. The most recent market data puts the share price at about $359.79. That is up 1.98% on the session. At that price the company is worth roughly $138.81B.
Over the past 52 weeks, CB has traded between $266.40 and $365.91. Shares change hands at a trailing price-to-earnings (P/E) ratio of about 12.7. The P/E ratio sets the share price against a year of earnings. A higher number means the market is paying more for each dollar the company earns. CB also pays a dividend. It yields around 1.13% at the current price.
Key statistics
Source: Yahoo Finance - quote as of 2 days ago
Informational only, not financial advice. Content is AI-generated and may contain errors. How this works.
Why investors watch CB
CB is one of the larger names in the Financials sector, so investors follow it closely. It tends to move with the rest of the sector. This page sums up each CB story as it breaks, and tags it bullish, bearish or neutral.
Size matters here as well. The S&P 500 is weighted by market value. CB is large enough that its own share price nudges the whole index. So it is worth watching even for investors who only hold index funds.
What moves CB
- Earnings. CB reports results four times a year. A surprise against the estimate tends to move the stock that day.
- Analyst calls. Upgrades, downgrades and new price targets change what the market expects from CB.
- Sector news. Financials stocks often move together, so a rival's news can move CB too.
- Index weight. CB is big enough to move the S&P 500 on its own.
Market Mood
Latest CB news

10-year Treasury yield ticks higher despite weaker-than-expected jobs report
{ "title": "10-Year Treasury Yield Rises 5 Basis Points to 5.281%", "summary": "The 10-year Treasury yield rose nearly 5 basis points to 5.281% on Friday despite an unexpectedly weak September jobs report. This came after the yield initially fell, likely due to job additions of only 29,000, far below the Dow Jones prediction of 84,000. Unemployment also ticked up to 4.2% from 4.1%. Other yields increased as well, with the 30-year Treasury yield adding 3 basis points to 5.634%, and the 2-year Treasury yield, sensitive to Federal Reserve actions, rising by 4 basis points to 4.831%." , "Traders now see a 77% probability that the Federal Reserve will hold rates steady in October, though a December hike remains likely. Analysts like Timothy Chubb of Girard Advisory Services and Lindsay Rosner from Goldman Sachs Asset Management suggest that while the Fed may pause in October, the rate hiking cycle might not be over. Rosner noted that soft employment data argues against a tightening labor market."
Read More: 10-year Treasury yield ticks higher despite weaker-than-expected jobs report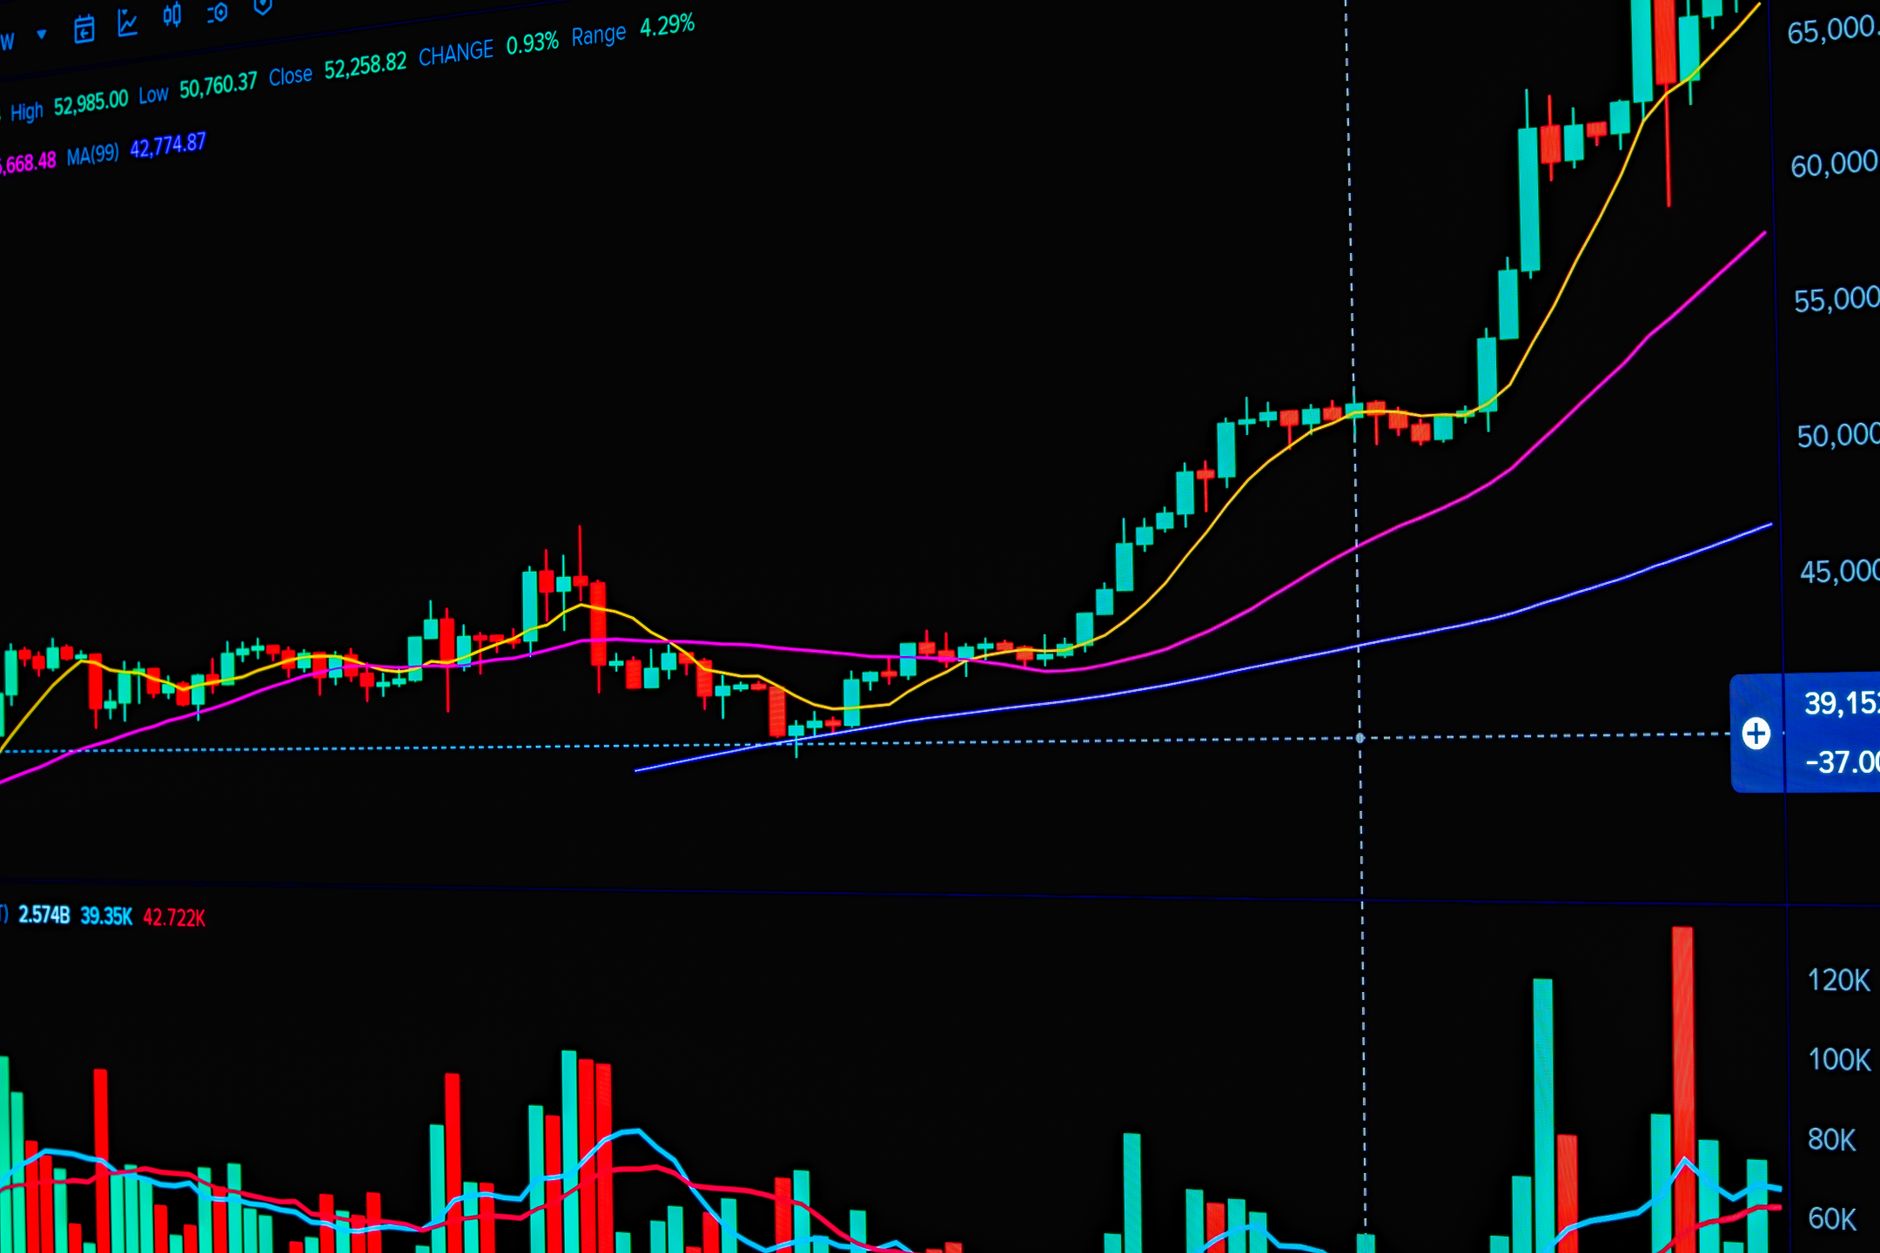
Clear Blue Q2 2026 Profit Marks Stock Rise
Clear Blue reported a profit in Q2 2026, contributing to an increase in its stock price. The specifics of the profit and the percentage increase in stock value were not disclosed in the article. This positive earnings result may attract investor interest, indicating potential growth opportunities. Such developments are significant for markets as they can affect trading volumes and investor sentiment towards the company. This news could be relevant for Ordinary investors watching Clear Blue's performance.
Read More: Clear Blue Q2 2026 Profit Marks Stock Rise
Chubb Ltd (CB) Form 144 Filed on May 27 Update
Chubb Ltd (CB) filed Form 144 on May 27, indicating potential stock sales by insiders or affiliates. Form 144 is typically filed when a person intends to sell restricted or control securities. The filing does not specify the number of shares involved or the intention behind this filing, limiting the potential market impact details. Monitoring such filings can indicate insider confidence or lack thereof in the company's future performance.
Read More: Chubb Ltd (CB) Form 144 Filed on May 27 Update
Chubb (CB) Price Target Raised to $333 by Wells Fargo
Wells Fargo has increased its price target for Chubb Limited (CB) from $321 to $333, maintaining an Equal Weight rating. Citizens Financial Group also raised its price goal for Chubb to $365 from $350, holding an Outperform rating. Despite an earnings beat, Chubb shares declined due to concerns about softening property markets. Both firms emphasize Chubb's strong global exposure and diversified business mix as key growth drivers, particularly in emerging markets.
Read More: Chubb (CB) Price Target Raised to $333 by Wells FargoMore Financials stocks
Frequently asked questions
Is Chubb Limited in the S&P 500?
Yes. Chubb Limited trades as CB and is a member of the S&P 500. The index lists it in the Financials sector.
What sector is CB in?
CB sits in the Financials sector of the S&P 500.
Where can I find the latest CB news?
Right here. This page collects recent CB news and market analysis. Every story gets an AI summary and a bullish, bearish or neutral tag.
What is Chubb Limited's stock price?
CB last traded at about $359.79. Prices move all through the session, so this is the latest quote rather than a live one.
What is Chubb Limited's market cap?
CB is worth roughly $138.81B. Market cap is the share price times the number of shares outstanding.
What is CB's P/E ratio?
CB trades at a trailing P/E ratio of about 12.7. The ratio compares the share price with earnings per share over the past year.